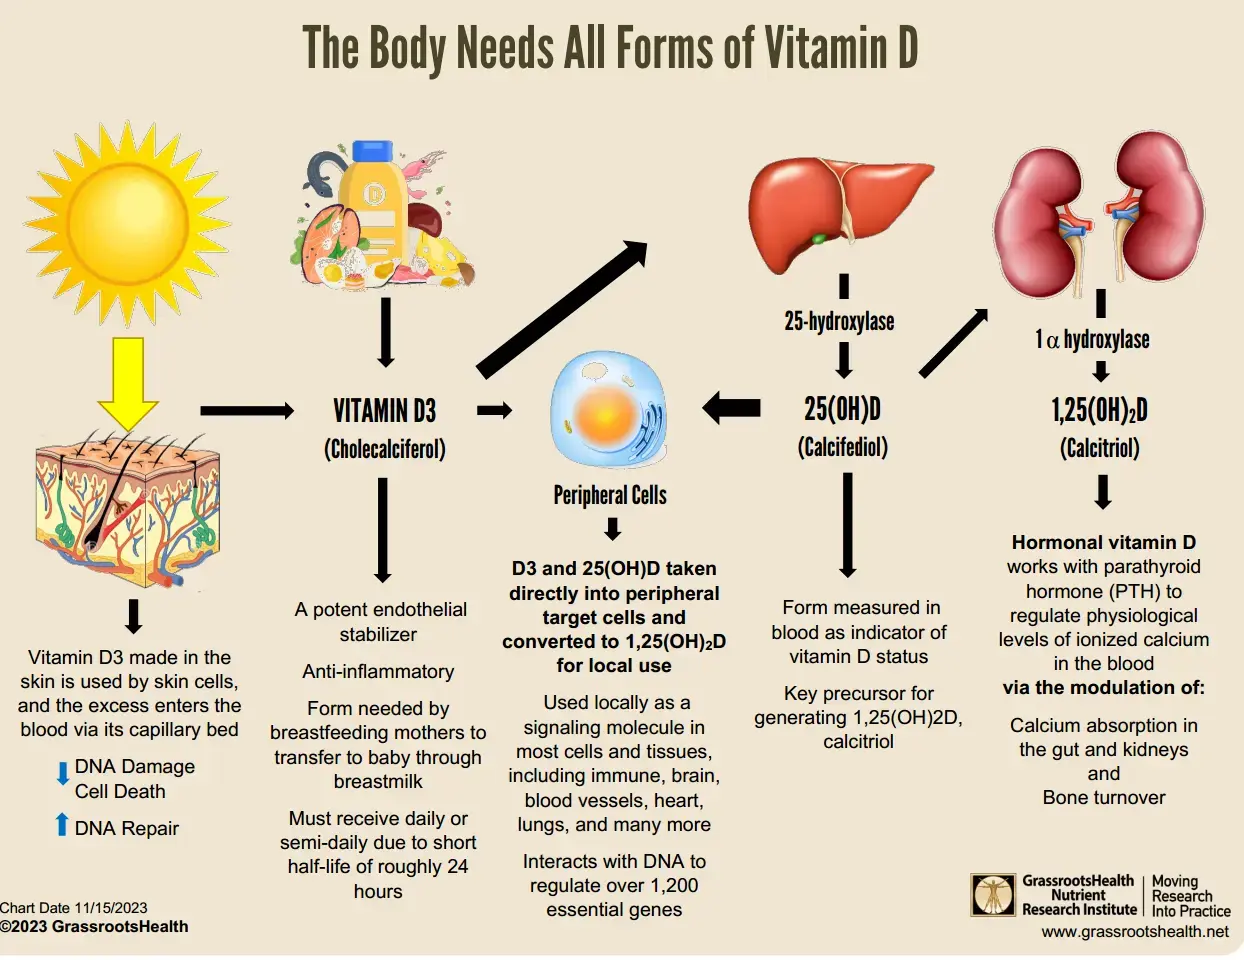
Vitamin D charts from GrassrootsHealth
Update 2023
📄 Download all ~40 of the charts from Vitamin D Life
Here are a few of the ~40 charts
Alternately: Browse Grassroots Health for Charts
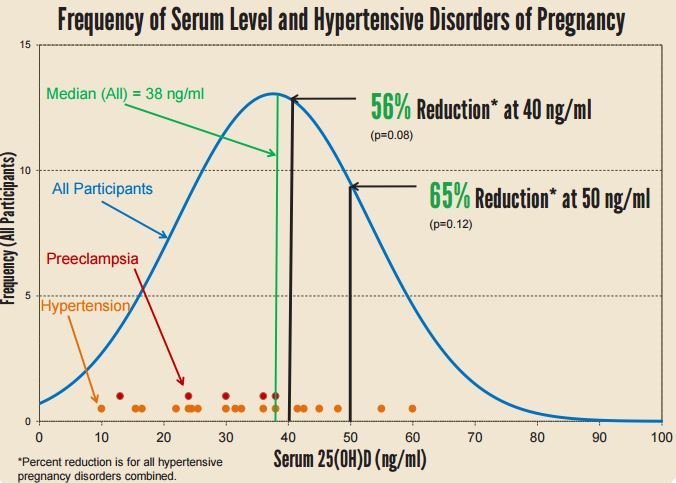
Hypertension during pregnancy - none above 60 nanograms?
 }
}
See also Preeclampsia changes to Vitamin D Binding Protein reduces Vitamin D in placenta – Dec 2016
Without a loading dose it takes ~5 months (20 weeks) to get adequate vitamin D levels

See also some GrassrootHealth Charts on Vitamin D Life
Grassroots Health participants Vitamin D vs age, intake, and resulting level – Sept 2013
68 percent got vitamin D above 40 ng by regular use of tanning bed - July 2013
Response to high dose vitamin D is limited by vitamin A - July 2013
A group of 6,000 people have vitamin D levels higher than 50 ng – GrassrootsHealth
Diabetes 10X less frequent among people getting lots of vitamin D - Aug 2013
Chart of Vitamin D levels vs disease - Grassroots Health June 2013
Chart titles in the file which you can batch download
Serum Level vs Intake
Disease Incidence Prevention by Serum 25(OH)D Level
Serum Level vs Intake (Ages 18+ years)
Serum 25(OH)D vs Vitamin D Supplement Intake
Vitamin D Supplement Intake Per Pound vs. Serum 25(OH)D Concentration (Ages 18+ Years)
Vitamin D Supplement Intake vs. Serum 25(OH)D Concentration (Ages 18+ Years)
Vitamin D Dose (IU) to Ensure 90% of Adults Achieve Specified 25(OH) D Concentration (Ages 18+ years)*
Vitamin D Intake and Toxicity
Disease Incidence Prevention for Pregnancy Complications and Birth Outcomes
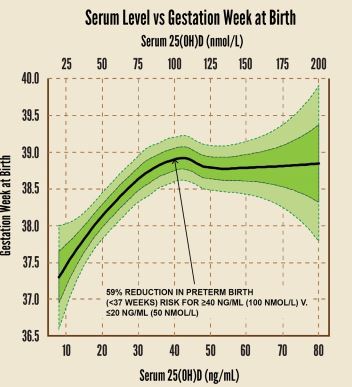
Fitted LOESS Curve of 25(OH)D Concentration within 6 Weeks of Delivery by Gestational Age (Weeks) at Birth
Frequency Distribution of 25(OH)D Concentration and Hypertensive Disorders of Pregnancy within 6 Weeks of Delivery
Serum 25(OH)D Concentration by Race/Ethnicity (U.S. Women Aged 18-45 years)
Average Serum 25(OH)D Concentration by Gestation Week and Treatment Group (see above)
Cancer Incidence is 71% Lower for >40 ng/ml vs <20 ng/ml (Women Ages 55+ Years)
Frequency Distribution of 25(OH)D among Cases and Non-Cases of Breast Cancer (Women Aged 60+ Years)
Non-Skin Cancer Cases in the GrassrootsHealth and Lappe Cohorts (Women Ages 55+ Years)
Non-Skin Cancer Incidence Rates: GrassrootsHealth vs. Lappe Cohorts (Women Ages 55+ Years)
Frequency Distribution of 25(OH)D among Cases and Non-Cases of Kidney Stones
Incidence Rate of Type 2 Diabetes is >50% Lower in GrassrootsHealth vs. NHANES (Participants Ages 20+ Years)
Pain Rating vs Serum Level
Experienced a Cold or Flu in Prior 6 Months by Vitamin D Status
Experienced a Broken Bone in Prior 6 Months by Vitamin D Status (Ages 65+ years)
Initial 25(OH)D Concentrations and Vitamin D Intake Amounts for “Vitamin D for Public Health” Seminar Participants
Serum 25(OH)D3 Increase for Each Food Source
Serum Level by Sun Exposure Amount for Non-Supplement Takers
Percent of Participants per Reported Vitamin D Supplement Type
Average Vitamin D Serum Level by Reported Supplement Type and Intake Amount
Average Serum Level by Vitamin D Supplement Amount (Ages 18+ Years)
Vitamin D Dose Response Curves for Vitamin A Intake Amounts
Physical Activity Among D*action Participants
Dose Response by Physical Activity Level
Vitamin D Supplement Intake by Age
Vitamin D Serum Level by Age
Vitamin D Serum Level by Gender
Vitamin D Supplement Intake by Latitude
Vitamin D Serum Level by Latitude
Vitamin D Supplement Intake by Percent Outdoor Occupation
Percent of Occupation Performed Outdoors During Daylight
Median Vitamin D Intake by Month of Year*
D*action Participant Counts in the United States
D*action Vitamin D Serum Levels in the United States
D*action Around the World