Many people now have low levels of Potassium, interactions with Vitamin D
Potassium Intake and Deficiency: An Evidence-Tiered Review TL;DR
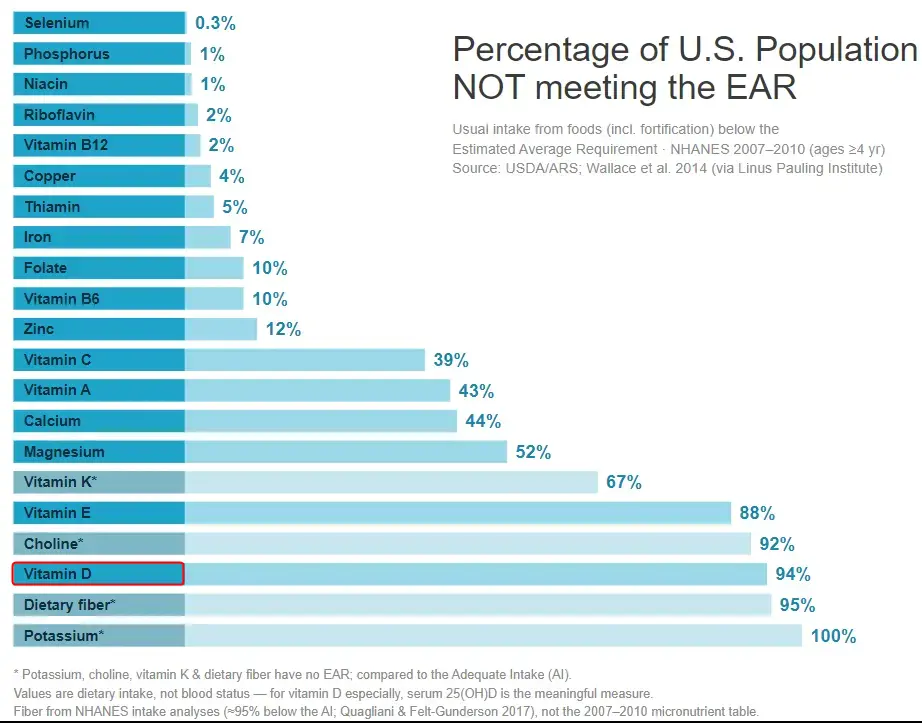
The "100% not meeting the EAR" figure for potassium is a methodological artifact, not a measure of clinical deficiency: potassium has no EAR, so the LPI/Wallace chart compares intake to the Adequate Intake (AI), which in 2005 was set at a high 4,700 mg/day. Actual US intakes (men ~2,988–3,016 mg/day; women ~2,320–2,323 mg/day) fall short of that benchmark for essentially everyone, but this reflects low dietary intake against an aspirational target—not frank hypokalemia, which is a distinct clinical electrolyte disorder.
The health case for higher potassium is strongest for blood pressure and stroke (high-quality RCT/meta-analytic evidence) and for kidney-stone and bone-turnover surrogate endpoints (good RCT evidence), but weaker for hard mortality endpoints, where the best data come from the 2021 SSaSS salt-substitution trial and observational cohorts confounded by overall diet quality.
For Vitamin D Life's audience, the most defensible potassium–vitamin D link is a shared magnesium dependency, not a shared RAAS action: vitamin D suppresses renin, whereas potassium directly stimulates adrenal aldosterone even as it suppresses the intrarenal RAS—so the "both suppress RAAS" framing is an oversimplification that should be corrected.
Key Findings
1. Why potassium reads "100%": the AI-versus-EAR problem
The chart (Wallace et al. 2014, J Nutr, using NHANES 2007–2010, ages ≥4 yr, via the Linus Pauling Institute) shows potassium at 100% "not meeting the EAR." As the chart's own footnote states, potassium—along with fiber, choline, and vitamin K—has no EAR. When the National Academies cannot establish an Estimated Average Requirement (the intake meeting the needs of 50% of the population), they instead set an Adequate Intake (AI), defined as an observed/experimental approximation of intake "assumed to be adequate."
- The 2005 IOM AI was 4,700 mg/day for all adults, derived from experimental blood-pressure, kidney-stone, and bone data. Median US intakes (~2,600 mg/day population-wide) fall so far below 4,700 mg that essentially 100% of the population is classified as "below the AI." Wallace et al. found the estimated usual potassium intake was 2,606 mg/day, with multivitamin/mineral supplements adding only ~11 mg/day.
- Critically, this is not an EAR-style deficiency estimate. An EAR-based "% below" figure estimates the fraction of people with intakes below their actual physiological requirement. An AI-based "% below" figure only tells you how many people fall short of a fixed reference intake—if the AI is set high, nearly everyone will be "below" it by construction, even if few are physiologically deficient. Combining potassium's AI-based number with EAR-based numbers for other nutrients on the same chart is comparing unlike quantities.
- The 2019 National Academies revision made this explicit by LOWERING the AI. Because the 2019 committee based the new AIs on the highest median intakes observed in national surveys (rather than on experimental chronic-disease data), the adult AI dropped to 3,400 mg/day for men and 2,600 mg/day for women (ranging 2,300–3,400 mg/day across life stages). The committee also introduced the Chronic Disease Risk Reduction (CDRR) category but concluded there was insufficient evidence to set a potassium CDRR (they did set one for sodium). No Tolerable Upper Limit (UL) was set for potassium in healthy people.
- The consequence: under the old 4,700 mg AI, <3% of US adults "met" the target (NHANES 2011–2012, mean 2,795 mg/day). Under the revised 2019 AIs, a substantially larger share of women (whose AI is now 2,600 mg) meet the target, since female mean intake (~2,320 mg) is much closer to the new benchmark. The "crisis" shrinks considerably purely from redefining the reference value.
- Intake vs. status. The 2019 report is blunt that "blood electrolyte concentrations are usually not influenced by dietary intake, as kidney and hormone systems carefully regulate blood values." Low dietary potassium intake and clinical hypokalemia (serum K⁺ <3.5 mmol/L) are different things: hypokalemia has defined causes—diuretics, GI losses, hyperaldosteronism, magnesium depletion—and is not the same as chronic suboptimal intake in an otherwise healthy person with normal serum potassium. (This is the same intake-vs-status distinction Vitamin D Life readers will recognize from serum 25(OH)D versus dietary vitamin D.)
2. Health problems associated with low potassium intake
Blood pressure (Tier 1 — high-quality RCT/meta-analysis). Increasing potassium lowers blood pressure, with the effect concentrated in hypertensive and high-sodium individuals:
- Aburto et al. (BMJ 2013;346:f1378), the WHO-commissioned systematic review, graded the BP evidence as high quality: increased potassium reduced systolic/diastolic BP in hypertensives and had no adverse effect on lipids, catecholamines, or renal function.
- Effect sizes vary by population. The classic meta-analysis of 19 supplement trials (Cappuccio & MacGregor, J Hypertens 1991;9:465–473; 586 participants) found "oral potassium supplements was associated with a significant decrease in systolic BP of 5.9 mmHg (−6.6 to −5.2) and diastolic BP of 3.4 mmHg (−4.0 to −2.8)," with a larger −8.2/−4.5 mmHg effect in those with higher baseline BP. A later meta-analysis of 33 RCTs in normotensives found smaller reductions (~3.11/1.97 mm Hg). A 2025 dose–response meta-analysis (Clinical Kidney Journal) found a 50 mmol/day rise in urinary potassium was associated with ~5.3/3.6 mm Hg reduction in hypertensives but only ~0.5/0.1 mm Hg in normotensives.
- "What this does NOT show": the 2006 Cochrane review (Dickinson et al., CD004641), restricted to just 5–6 higher-quality trials, found NO statistically significant BP effect (SBP −3.9, 95% CI −8.6 to 0.8). The apparent benefit is sensitive to which trials are included; larger effects come from short trials in high-baseline-BP populations.
- The DASH diet (Appel 1997; Sacks DASH-Sodium 2001, NEJM) lowers BP by ~5.5/3.0 mm Hg overall and ~11.4/5.5 mm Hg in hypertensives, but DASH is a whole-dietary-pattern intervention (high potassium, magnesium, calcium, fiber; low fat)—the potassium contribution cannot be isolated.
Stroke (Tier 1–2 — consistent observational + meta-analytic).
- Aburto et al. (2013) found higher potassium associated with a 24% lower stroke risk (moderate-quality evidence), with 90 mmol/day (~3,500 mg) associated with lowest risk.
- D'Elia et al. (Nutr Metab Cardiovasc Dis 2014), pooling 14 cohorts (333,250 participants, 10,659 events): RR 0.80 (95% CI 0.72–0.90) highest vs. lowest intake.
- "What this does NOT show": these are observational; potassium intake tracks fruit/vegetable intake and overall diet quality, so residual confounding cannot be excluded (the authors acknowledge this).
Cardiovascular disease and mortality (Tier 2, with one Tier 1 trial). - The Cook et al. TOHP follow-up (Arch Intern Med 2009;169:32) found a higher sodium-to-potassium excretion ratio associated with increased CVD, stronger than either electrolyte alone.- The single best hard-endpoint RCT is SSaSS (Neal et al., NEJM 2021;385:1067)—see Section 3.
- "What this does NOT show": observational potassium–mortality associations are inconsistent. The Korean Genome and Epidemiology Study (KoGES; Kim et al., Frontiers in Nutrition 2022;9:1053585), following 143,050 adults over 10 years (5,436 all-cause deaths), found potassium inversely associated with all-cause mortality (Q5 vs Q1 HR 0.79, 95% CI 0.69–0.91) but the Na:K ratio itself NOT significantly associated after adjustment—and the authors explicitly concluded there is "inconclusive evidence of the association between dietary sodium, potassium, and the sodium-to-potassium ratio and all-cause and cardiovascular disease mortality."
Kidney stones (Tier 1 — RCT).
Potassium citrate raises urinary citrate and pH and lowers urinary calcium, inhibiting calcium-oxalate/phosphate stone formation. A Cochrane review (Phillips et al. 2015, CD010057; 7 RCTs, 477 participants) found citrate salts reduce recurrence and new stone formation vs. placebo, at the cost of GI side effects. This is the potassium anion (citrate/bicarbonate = alkali) at work, not potassium per se.
Bone health (Tier 1 for surrogates; Tier 3 for fracture). The acid-base/alkaline-diet hypothesis holds that the modern net-acid-producing diet mobilizes skeletal alkaline calcium salts, contributing to bone loss.- Sebastian et al. (NEJM 1994;330:1776) showed potassium bicarbonate improved calcium balance and lowered bone-resorption markers in postmenopausal women.- Dawson-Hughes et al. (J Bone Miner Res 2015) found KHCO₃ lowered urinary NTX (resorption) ~18.7% and serum P1NP ~10.7%.- Jehle et al. (JCEM 2013) found 60 mmol/day potassium citrate over 2 years increased bone formation markers.
- "What this does NOT show": these are surrogate endpoints (markers, calcium balance), not fracture reduction. Critically, a factorial trial (Frassetto/Dawson-Hughes 2009, JCEM) concluded the benefit came from the bicarbonate/alkali anion, not the potassium cation—potassium alone did not significantly affect resorption. The whole acid-base bone hypothesis remains contested (see Nutrients 2018 review, "a controversial subject").
Glucose metabolism / diabetes (Tier 2–3).
Experimentally induced hypokalemia impairs insulin secretion and glucose tolerance (documented since the 1960s–80s); thiazide-induced hypokalemia is associated with increased diabetes risk. Mechanistically, insulin activates the Na⁺/K⁺-ATPase (driving K⁺ into cells), and ATP-sensitive potassium channels in pancreatic β-cells gate insulin release. A dose–response meta-analysis of 7 prospective studies (D'Elia et al., Nutrients 2022;14(22):4785) found a significant inverse association between dietary potassium and diabetes risk "starting from 2900 mg/day by questionnaire and between 2000 and 5000 mg/day by urinary excretion." "What this does NOT show": no RCT demonstrates that potassium supplementation prevents type 2 diabetes. As the NIH Office of Dietary Supplements states, "more research is needed to fully understand whether potassium intakes affect blood sugar levels and the risk of type 2 diabetes."
Left ventricular hypertrophy and arrhythmia (Tier 2–3). The CARDIA cohort found the urinary Na:K ratio more robustly associated with LV mass than either electrolyte alone. Animal models (DOCA/salt mice) show potassium supplementation reduces cardiac hypertrophy independent of BP. Hypokalemia is a well-established arrhythmogenic electrolyte disorder; the SSaSS cardiac substudy tracked arrhythmia and sudden death.
Mechanisms. Potassium is the dominant intracellular cation (~150 mmol/L intracellular vs. 3.5–5.0 mmol/L extracellular), and the Na⁺/K⁺-ATPase maintains this gradient and the resting membrane potential. Higher potassium promotes natriuresis (urinary sodium excretion), improves endothelial function and nitric oxide–mediated vasodilation, reduces vascular smooth-muscle tone and arterial stiffness, and modulates the renin-angiotensin-aldosterone system and renal sodium handling.
3. The sodium-to-potassium ratio as a central framing
A recurring argument is that the Na:K ratio predicts cardiovascular outcomes better than either electrolyte alone:
- INTERSALT and downstream analyses established population Na:K–BP relationships.
- Cook et al. TOHP follow-up (2009): higher Na:K excretion ratio associated with increased CVD, effect stronger than sodium or potassium alone.
- PURE (O'Donnell/Mente, NEJM 2014;371:612): 101,945 people, 17 countries; higher potassium excretion associated with lower risk of death/CV events; sodium showed a J-shaped curve (both high ≥7 g/day and low <3 g/day associated with higher risk). Mean excretion: sodium 4.93 g/day, potassium 2.12 g/day.
- 24-hour urine cohort (NEJM 2021;385, He/Cook et al.): higher sodium, lower potassium, and higher Na:K ratio each associated with higher CV risk using the gold-standard multiple 24-h urine measure (median 24-h sodium 3,270 mg).
- SSaSS (Neal et al., NEJM 2021): the landmark hard-endpoint RCT—20,995 rural Chinese adults with stroke history or age ≥60 with hypertension, cluster-randomized to salt substitute (75% NaCl / 25% KCl) vs. regular salt. Over mean 4.74 years: stroke reduced 14%, major CV events 13%, all-cause death 12%; SBP fell ~3.3 mm Hg. Hyperkalemia risk was not significantly increased (people with severe kidney disease and those on potassium-sparing drugs were excluded).
- "What this does NOT show": SSaSS cannot separate sodium reduction from potassium addition (a modeling paper attributes the BP drop to both); it was open-label, in a population with mostly home-cooked (not processed-food) salt, excluded CKD, and did not routinely monitor serum potassium. Editorialist Ingelfinger (NEJM) cautioned generalizability is "hard to predict." Observational Na:K data carry the usual diet-quality confounding.
Ancestral vs. modern ratio.
Eaton & Konner's Paleolithic-nutrition work (Eaton & Konner, N Engl J Med 1985;312:283–289; Eaton, Eaton III & Konner, Eur J Clin Nutr 1997;51:207–216) retrojected ancestral daily sodium at ~500–800 mg and potassium at ~7,400 mg, yielding a K⁺/Na⁺ ratio of ~14.8 and a dietary sodium/potassium ratio of ~0.07 for preagricultural humans. The modern Western diet has inverted this to a sodium/potassium molar ratio around or above 1—the WHO targets (≤2,000 mg sodium, ≥3,510 mg potassium) would produce a molar ratio ~1.0. Cordain, Eaton, Sebastian et al. (AJCN 2005, "Origins and evolution of the Western diet") list the sodium-potassium ratio inversion as one of seven fundamental Neolithic/Industrial dietary shifts driving "diseases of civilization."
4. Evolutionary/historical angle — when did intake fall below adequacy?
The "mismatch" hypothesis: human kidney and RAAS physiology evolved under a potassium-rich, sodium-poor diet, so our physiology is exquisitely good at conserving sodium and excreting potassium. The modern inverted diet stresses systems built for the opposite environment.
- Timeline: the shift began with agriculture (~10,000 years ago), which increased refined-grain staples (low potassium), but the decisive inversion came with 20th-century industrial food processing, which added sodium chloride and stripped potassium from refined foods, replacing potassium-rich plant foods (fruits, tubers, leafy greens) with energy-dense, nutrient-poor processed products.
- Sebastian, Frassetto et al. ("The evolution-informed optimal dietary potassium intake…," 2006) argue the modern diet substituted potassium-rich plant foods with separated fats, refined sugars, and refined grains, so average intake fell below adequacy largely within the last century.
5. Why isn't this on the public radar? ("Profitable ignorance")
Several structural reasons keep low potassium quiet:
- No commercial champion. Potassium is cheap, abundant, and unpatentable—no industry profits from promoting it, unlike patented drugs.
- The public-health message has been "cut sodium," not "add potassium." Decades of guidelines, the AHA, and the 2019 CDRR framework focused on reducing sodium; potassium got a weaker "nutrient of public health concern" label without a CDRR.
- The 99 mg supplement cap. US OTC potassium supplements are effectively limited to 99 mg/tablet (about 2% of the old DV). The FDA ruled certain solid oral potassium-chloride drug products providing >99 mg unsafe because they caused small-bowel lesions (ulceration, obstruction, hemorrhage, perforation), and requires warning labels; manufacturers voluntarily cap supplements at 99 mg. This makes it practically impossible to close a ~2,000 mg/day gap with pills—food and salt substitutes (KCl) are the realistic routes.
- Medical caution around hyperkalemia. In CKD and among users of ACE inhibitors, ARBs, and potassium-sparing diuretics, extra potassium can be dangerous, creating messaging hesitancy that spills over to the general population, who would actually benefit.
- The AI-vs-EAR statistical invisibility. Because potassium has no EAR, it does not appear cleanly in standard "deficiency" statistics; its shortfall is either invisibly baked into a 100% figure or dismissed as an artifact.
6. Potassium–vitamin D interactions (for Vitamin D Life)
This is where honest tiering matters most. The intuitive "both suppress the RAAS" story is partly wrong.
Well-established:
- Shared magnesium dependency is the strongest genuine link. Magnesium is an obligate cofactor for the CYP enzymes that activate and degrade vitamin D (CYP2R1, CYP27B1, CYP24A1)—Uwitonze & Razzaque (J Am Osteopath Assoc 2018) and Dai et al. (AJCN 2018, RCT) show magnesium status governs vitamin D metabolism bidirectionally (raising low 25(OH)D and lowering high 25(OH)D). Magnesium is also required for renal potassium retention: intracellular Mg²⁺ blocks the ROMK channel, so hypomagnesemia causes renal potassium wasting and refractory hypokalemia that cannot be corrected until magnesium is replaced (Huang & Kuo, J Am Soc Nephrol 2007;18:2649). Thus magnesium sits at the center of both vitamin D and potassium homeostasis—a genuinely shared node, and a natural cross-link for Vitamin D Life's existing magnesium content.
- Vitamin D suppresses renin transcriptionally via the VDR blocking CREB at the renin promoter (Li et al., J Clin Invest 2002;110:229; Yuan et al., J Biol Chem 2007;282:29821)—robust in molecular/animal models; VDR-null mice develop elevated renin, angiotensin II, hypertension, and cardiac hypertrophy.
- Potassium (as alkali salt) and vitamin D both influence calcium balance/bone, but through complementary, not identical, routes: vitamin D increases calcium input (intestinal absorption); potassium alkali reduces calcium loss (urinary excretion). No major RCT has tested them jointly on bone.
The RAAS paradox (correct this framing): Potassium's RAAS effect is bidirectional and opposite to vitamin D at the adrenal level. Potassium is a direct stimulus for aldosterone secretion—elevated serum K⁺ depolarizes zona glomerulosa cells, opening voltage-gated Ca²⁺ channels and upregulating aldosterone synthase (CYP11B2). So raising potassium raises systemic aldosterone acutely (a human crossover RCT, Nephrol Dial Transplant 2021;36:1282, confirmed higher potassium intake markedly stimulates measured RAAS hormones). Yet in animal models a high-potassium diet suppresses the intrarenal RAS (renal ACE, angiotensinogen, collecting-duct renin) and lowers BP. Vitamin D, by contrast, cleanly suppresses renin. The two nutrients therefore do NOT act identically on the RAAS—presenting them as parallel RAAS suppressors is an oversimplification that should be corrected on the page.
Mechanistically plausible / mixed:- Vitamin D lowers aldosterone in humans, but modestly and inconsistently: Grübler et al. (J Clin Hypertens 2016;18:608, Styrian Hypertension Study) found vitamin D produced a smaller rise in plasma aldosterone than placebo (+0.9 vs +3.3 ng/dL, P=.04), but the parent trial missed its BP endpoint; Boxer et al. (2014) found aldosterone fell but renin was unchanged.
Speculative:
- A direct VDR–mineralocorticoid-receptor (MR) molecular interaction has been hypothesized (both are nuclear-receptor-superfamily members; Armanini/Sabbadin) but there is no physical evidence of a VDR-MR heterodimer (documented heteromers are MR-GR). Intracellular Ca²⁺—governed by vitamin D and driving potassium-induced aldosterone synthesis—is a plausible shared signaling node, but the causal link is unproven.
- No dedicated vitamin D × potassium blood-pressure trial exists; any synergy claim is extrapolation. Combined-micronutrient work has paired vitamin D with magnesium or vitamin K, not potassium.
Details: evidence-tier summary
- Tier 1 (RCT/meta-analysis): potassium ↓ blood pressure in hypertensives (Aburto BMJ 2013; Cappuccio & MacGregor 1991; multiple meta-analyses); potassium citrate ↓ kidney-stone recurrence (Cochrane 2015); potassium bicarbonate/citrate ↓ bone-resorption markers and urinary calcium (Sebastian NEJM 1994; Dawson-Hughes 2015; Jehle 2013); salt substitution ↓ stroke/CV events/death (SSaSS, NEJM 2021).
- Tier 2 (strong observational/cohort): potassium ↓ stroke risk (D'Elia 2014; Aburto 2013); higher Na:K ratio ↑ CVD (Cook TOHP 2009; PURE 2014; 24-h urine cohort NEJM 2021); potassium ↓ diabetes risk (D'Elia meta-analysis, Nutrients 2022).
- Tier 3 (mechanistic/animal/speculative): LVH reduction independent of BP (DOCA/salt mice); acid-base bone hypothesis (contested; anion may matter more than K⁺); vitamin D × potassium synergy; direct VDR-MR interaction.
Recommendations
- Reframe the Vitamin D Life page around the AI-vs-EAR distinction first. State plainly that "100% not meeting the EAR" is a category error—potassium has no EAR—and that the honest statement is "essentially all Americans fall below the potassium Adequate Intake, and roughly half or more fall below the revised (lower) 2019 AI." Show both the 2005 (4,700 mg) and 2019 (3,400 M / 2,600 F) numbers and explain why the target dropped. This directly parallels the intake-vs-serum-status logic your audience already applies to vitamin D.
- Lead the health case with the Tier 1 evidence (BP, stroke, kidney stones, SSaSS) and explicitly cabin the mortality/hard-endpoint claims as resting largely on one trial (SSaSS) plus confounded observational data.
- Emphasize food-first and salt-substitution, not pills. Because of the 99 mg supplement cap, tell readers the practical routes are potassium-rich whole foods (fruits, vegetables, tubers, legumes, dairy) and KCl-based salt substitutes—while flagging the CKD/ACE-inhibitor/ARB/K-sparing-diuretic contraindications.
- For the potassium–vitamin D section, foreground magnesium as the shared cofactor and explicitly correct the "both suppress RAAS" oversimplification. Present the RAAS paradox honestly. Tag the VDR-MR interaction and any D×K synergy as speculative.
- Benchmarks that would change these recommendations: a dedicated potassium-supplementation RCT with hard CV endpoints in a Western processed-food population (would strengthen the mortality claim); a potassium CDRR from the National Academies (would restore a clean "deficiency" statistic); fracture-endpoint trials of potassium alkali (would upgrade the bone claim from Tier 1-surrogate to Tier 1-outcome); a factorial vitamin D × potassium (or × magnesium) trial (would move the interaction claims out of speculation).
Caveats
Intake ≠ status ≠ deficiency. Nearly all the "shortfall" data describe dietary intake versus a reference value, not measured potassium status. Serum potassium is tightly regulated and usually normal despite low intake; frank hypokalemia is a separate clinical entity with specific causes.
The anion problem. Much of the bone and stone benefit tracks the alkalinizing anion (citrate/bicarbonate), not potassium itself; potassium chloride (as in salt substitutes) does not alkalinize. Conflating "potassium" with "potassium alkali" overstates the case for the cation.
- Confounding pervades the observational literature. Potassium intake is a marker of fruit/vegetable consumption and overall diet quality; cohort associations for stroke, CVD, diabetes, and mortality cannot fully separate potassium from the healthy dietary patterns that carry it.
- Reverse J-curves and safety. Both very low and very high sodium (and by extension extreme Na:K manipulation) show J-shaped mortality relationships in some cohorts; potassium loading is genuinely dangerous in CKD and with RAAS-blocking or potassium-sparing drugs. "More potassium" is not universally safe advice.
- The evolutionary numbers are estimates. Paleolithic intake figures (~7,400 mg/day potassium, and the higher 7,000–11,000 mg/day range cited elsewhere) are retrojections from ethnographic and botanical data, not measurements, and should be presented as informed estimates, not facts.
Related in Vitamin D Life
- 12 Strange Signs Your Body Needs Potassium - video
- High Sodium may not be the problem: used to get 16X more Potassium than Sodium
- Early humans had much higher levels of: Vitamin D, Vitamin C, Iron, Zinc, Potassium, etc
- People are not getting even the minimal nutrients, such as Vitamin D